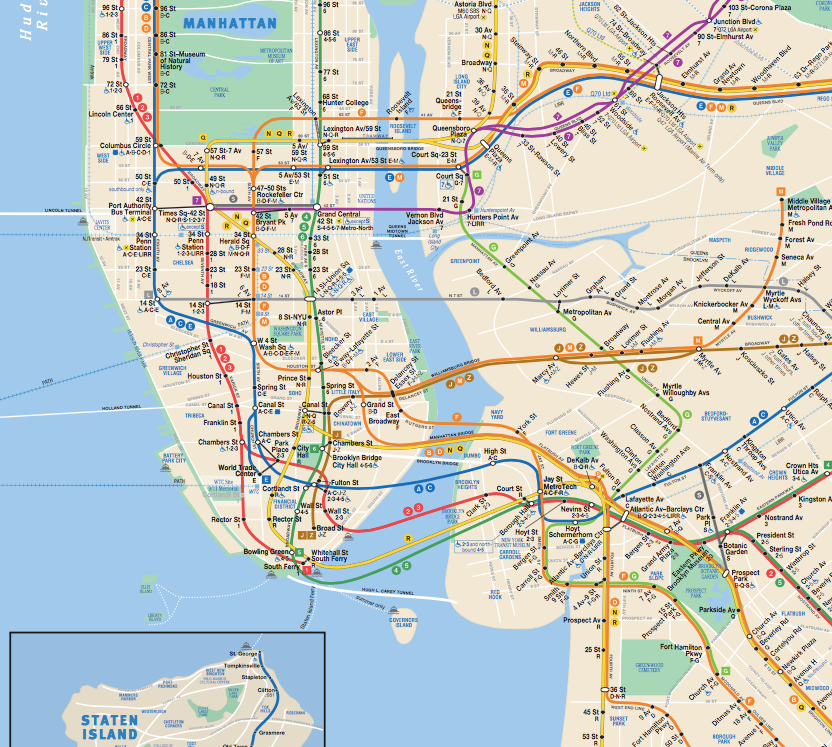
David J. Broadwater

Data Scientist


NYC Subway System:
Does Rain Affect Subway Ridership?

Do more people ride the subway when it's raining outside than when it isn't raining? The answer isn't as intuitive as you would think. This project involved wrangling actual NYC Subway data, then analyzing it using statistical methods and data visualization.

You can read my analysis here, or look at the code used to create it. This project was completed as part of the Udacity Data Analyst Nanodegree.

Skills used: Python, NumPy, Pandas, PandasSQL, SQL, ggplot, linear regression, gradient descent, MapReduce

Wrangling San Diego OpenStreetMap Data

Data analysis is great, but it usually takes some work to get real data into a format that actually be analyzed. This project involved applying data munging (or wrangling/cleaning) techniques on OpenStreetMap data for an area of our choice. These techniques included assessing the quality of the data for validity, accuracy, completeness, consistency and uniformity, and then correcting the issues identified in the data. Finally, all of the cleaned data was imported into MongoDB and then queried to gain insights about the area. If you've always wondered what the most popular fast food restaurant in San Diego is, read on!

You can read my analysis here, or look at the code used to create it. This project was completed as part of the Udacity Data Analyst Nanodegree.

Skills used: Python, MongoDB, XML, ElementTree, JSON

Analyzing the Enron Email Dataset:
Is it possible to use machine learning to identify persons of interest in the Enron fraud case?

Enron was the source of one of the largest corporate fraud cases in history. For this project, machine learning algorithms were used to exploit relationships and patterns in email and financial data from the Enron fraud case to identify persons of interest (POIs). This involved determining the best information (or features) to use in the financial and email data, testing/training four different machine learning algorithms, optimizing their performance, and selecting the best algorithm.

To find out which algorithm performed the best, you can read my analysis here, or look at the code used to create it. This project was completed as part of the Udacity Data Analyst Nanodegree.

Skills used: Python, Machine Learning, Naive Bayes, Decision Tree, Support Vector Machine (SVM), Scikit-Learn, Feature Selection, Cross-Validation, Algorithm Evaluation/Selection, Text-Learning, NLTK.

Data Analysis with R:
What Chemical Properties Influence the Quality of Red Wine?

Roughly 1600 different Vinho Verde red wines from Portugal were measured for their chemical properties (such as alcohol content, residual sugar, density, etc.), along with a blind "quality" rating from three wine experts. For this project, R was used to explore the various relationships in the dataset and determine which chemical properties had the biggest influence on wine quality. All of the analysis was documented stream-of-consciousness style, in order to explain the thought process used along the way.

To find out which chemical properties had the biggest influence on quality, you can read my analysis here, or look at the code used to create it. This project was completed as part of the Udacity Data Analyst Nanodegree.

Skills used: R, Data Analysis, Data Visualization, Multivariate Analysis, Statistics.

Data Visualization with D3 and dimple.js:
Which airline carriers had the best on-time performance in 2014?

Since 2003, Airline Carriers that generate at least 1% of total domestic revenue have been required by the US Department of Transportation (DOT) to report on-time data for domestic flights.

To find out which airlines performed the best in 2014, you can check out my data visualization here, or read some background about the design rationale used and how the design iterated based on user feedback. This project was completed as part of the Udacity Data Analyst Nanodegree.

Skills used: Data Visualization, Data Analysis, D3, dimple.js.